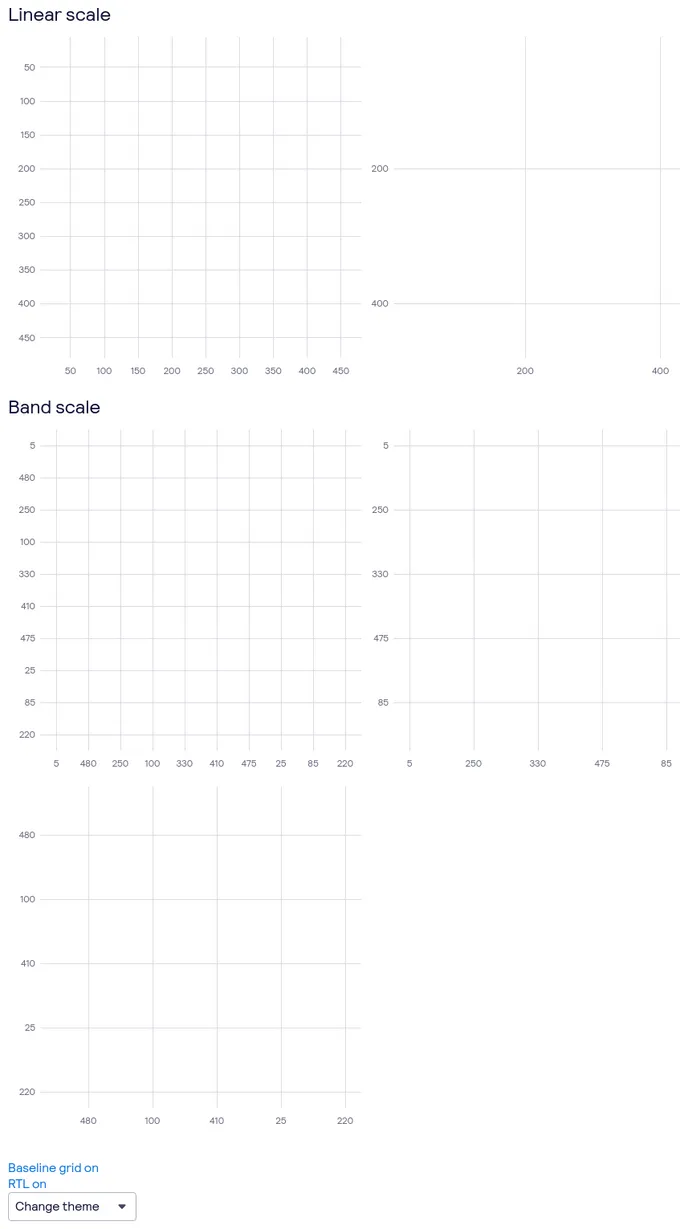
Chart components
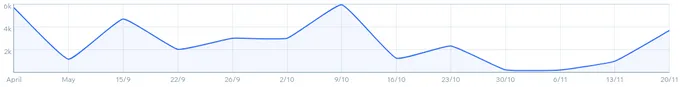
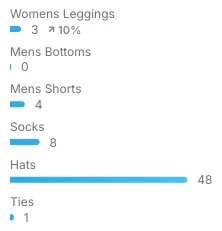
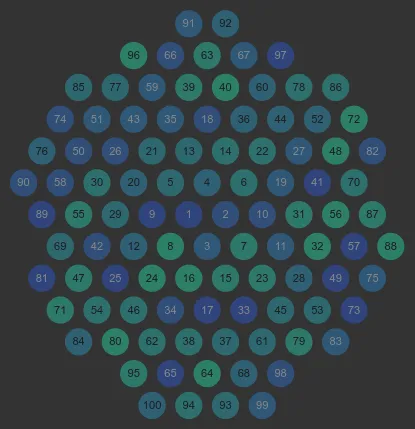
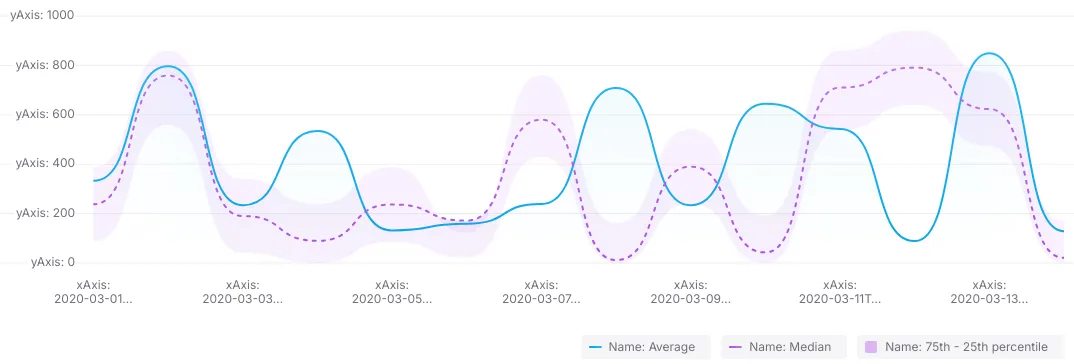
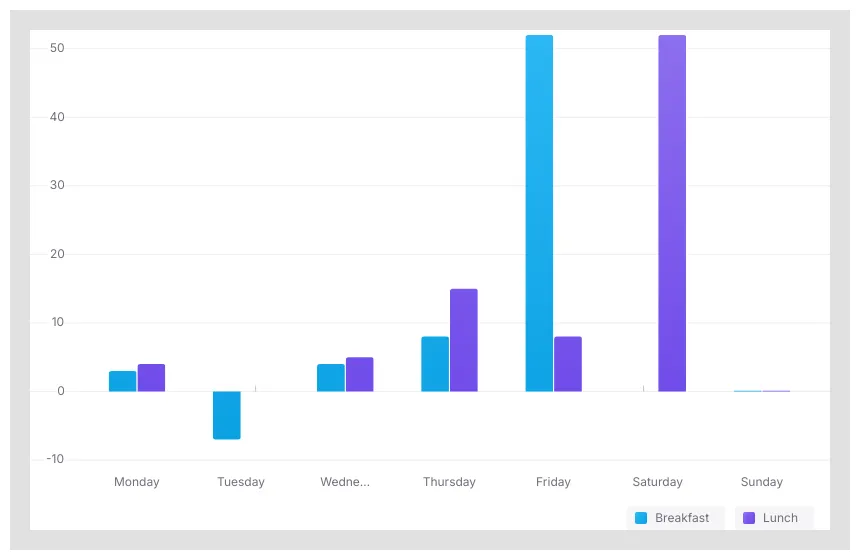
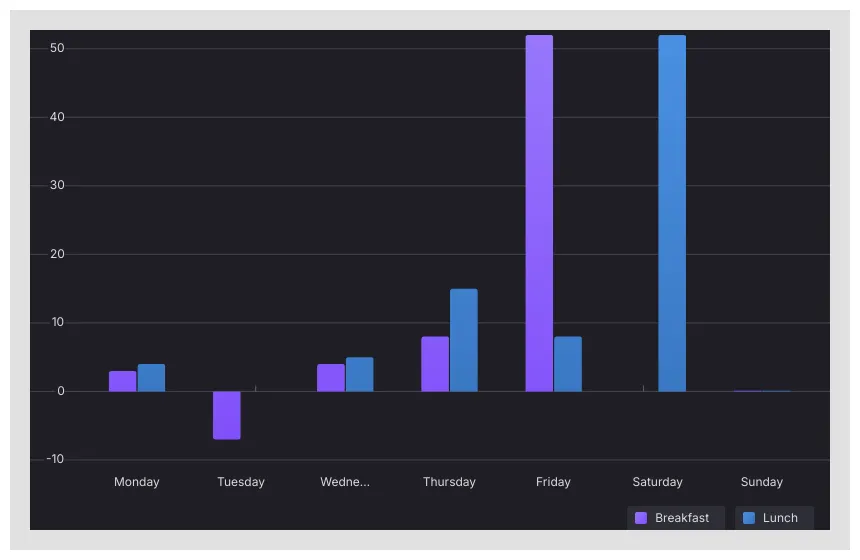
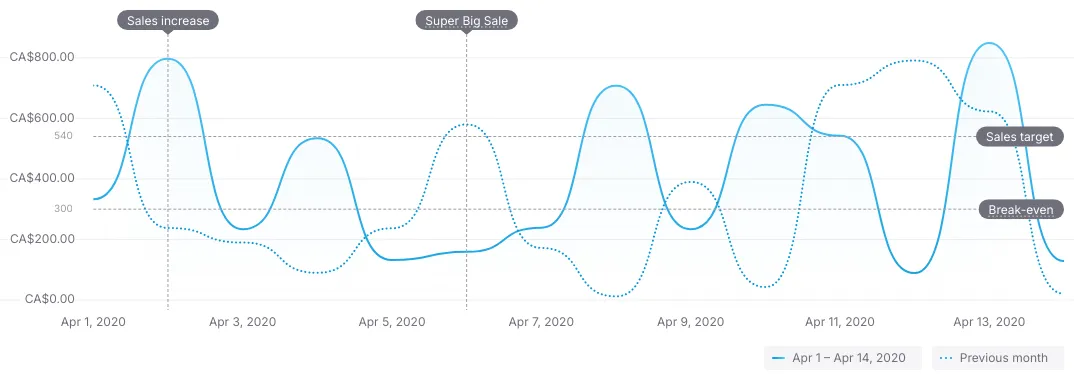
Chart is a graphical representation of data. A chart visualizes large sets of information to help users understand trends and relationships between data points.
24components122storiesLast updated 2 months ago
Other Names
Chart is a graphical representation of data. A chart visualizes large sets of information to help users understand trends and relationships between data points.